Having a flashy website doesn’t guarantee it’s accomplishing your business goals. It may have plenty of bells and whistles, load quickly, and provide a seamless user experience. But is your website effective? How many people visit your site? What do they do once they get there? Google Analytics can provide these answers and more.
Google’s website analysis tool is free to use, though you need to include code in the build of your site to enable Google access. Your web developer can do that for you. Once your site is connected, the first page of Google Analytics shows you the basics for the past seven days – or you can change the time range – including:
- Number of visitors/users
- Number of sessions (visits)
- Bounce rate (percentage of visitors that leave after viewing only one page)
- Session duration (how long visitors stay on the site)
- Returning users
The landing page also shows how many users are on your site at the moment and what pages they are on.
Here are five ways to dig deeper in Google Analytics to gain important insights. In the next blog, we’ll explain how to apply these insights to improve your website and your business.
1. Google Analytics shows how people are getting to your site.
The Acquisition Overview report shows how people are coming to your site: through organic search (such as Google or Bing), social, direct (typing your URL in their web browser), or referral (from a link in another site or email). You will see percentages as well as total users and sessions.
Google Analytics also allows you to hone in on the referral sources. In this way, you can see if visitors came from specific campaigns (email or social media campaigns, for example). To do this, you need to tag URLs using UTM codes. This takes a little more technical know-how, which you can do yourself or have a professional web developer manage.
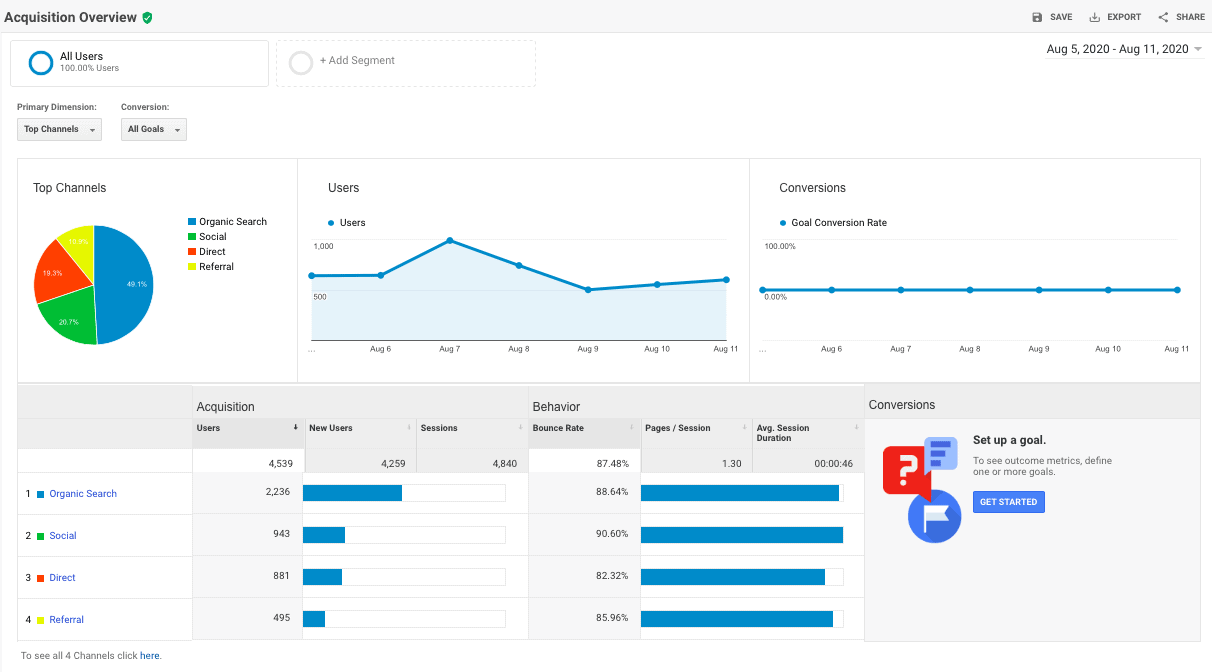
2. Reports reveal what users do on your site.
Once visitors land on your site, what do they do?
The Acquisitions Overview page shows
- How long visitors stay
- Bounce rate
- Pages per session
- Session duration
Then, dig a little deeper to see exactly where on your site users landed. You’ll know if they landed on your home page or on other specific pages. You’ll also see what they did once they arrived on each page. To get that additional information, under the Acquisition tab, click on Search Console > Landing Pages.
3. Learn the demographics of your audience.
The Audience Overview page reveals the total number of users coming to your site. It digs into details such as new visitors versus returning visitors and sessions per user.
The page delves further into demographic details, including country and city. It tells you what operating system (including mobile) and browser that visitors are using to view your site.
You can even see the gender and age. By adding Segments to the report, you can compare your overall user with other user groups, such as New Users, Returning Users, and Search Traffic.
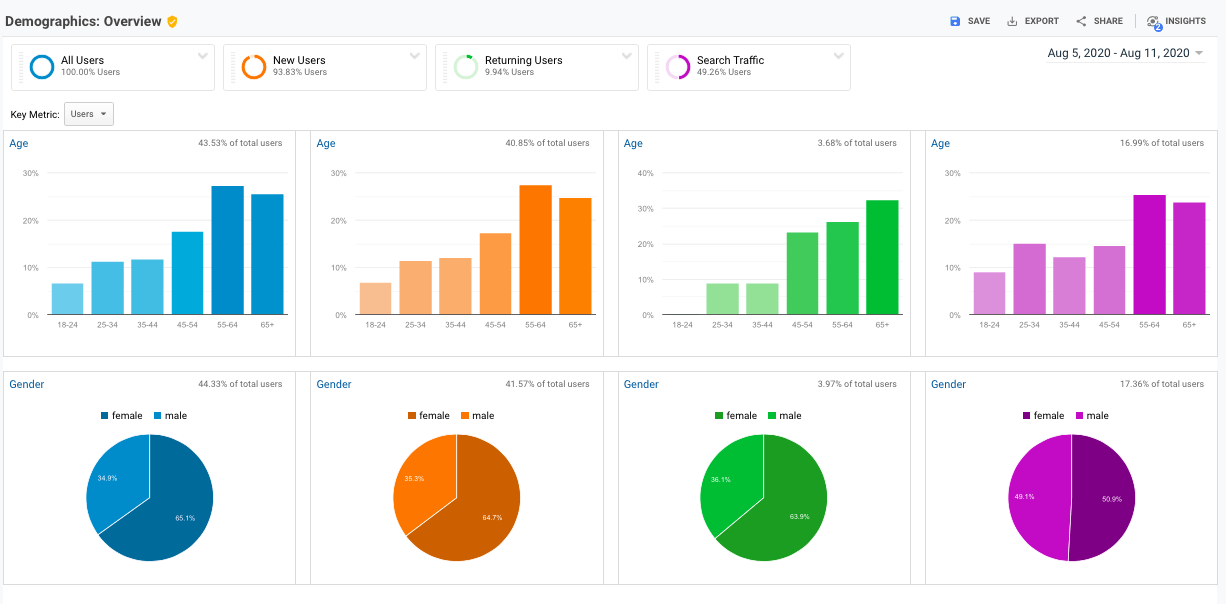
Google Analytics also tells you your visitors’ Interests: food, home and garden, real estate, news, media and entertainment, shopper, travel, pets, sports, etc. This report even narrows visitor Interest levels into Affinity Categories (individuals who have a long-standing interest in the category) and In-Market Segments (customers who are actively researching or looking to buy products and services).
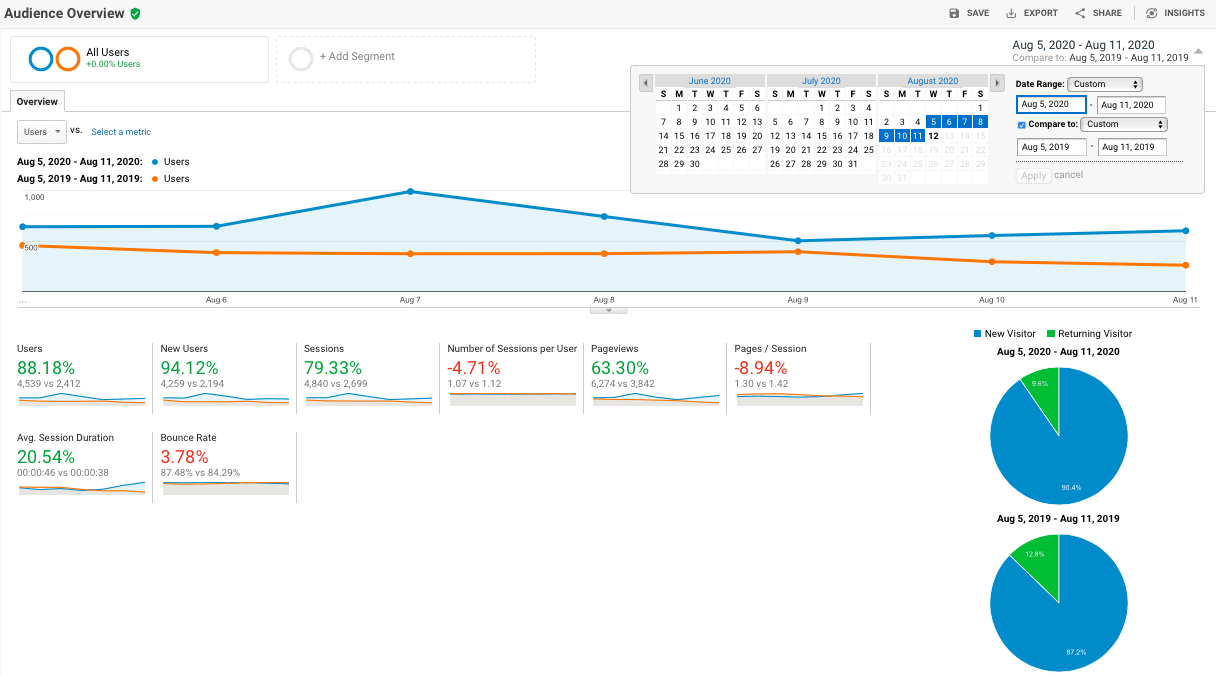
4. Google Analytics helps you understand when your site peaks and wanes.
Use the Audience Overview page to determine traffic peaks and dips, such as what months or seasons trend higher. Such reports can reveal if there are cycles of interest or seasonality in your business. In January and February, for example, more customers may be researching your products, so you should do more marketing at those times. Create comparison charts to measure growth. Dig and sift to find the information that best helps your business.
5. Find information on conversions.
In business, a conversion is any activity that assists your bottom-line success: a new lead, email sign-up, contact form submission, purchase, etc.
Google Analytics helps you track measurable website conversions, called Goals – i.e., how often users complete specific actions on the site. The system measures four types of goals: destination (when users land on a specific web page), duration (user sessions that last a specific amount of time or longer), pages per session, and event (such as a social recommendation, video play, or ad click). From there, you can use Multi-Channel Funnel reports to see how steps in the process worked together to create the end goal.
These website Goals need to be set up separately on the Analytics site. But it’s worth it: they can be invaluable in measuring how well your site is meeting your needs.
What next?
Such website information is fascinating, but it does no good unless you know how to apply Google Analytics to boost your business.
Google offers many of its handy, easy-to-use tools for free. Others take a bit more effort or investment. For more powerful tools to build your website and your business, contact a digital agency such as Ross Media Solutions.