Imagine going to a new store. Let’s say it’s a grocery store, and you need to pick up a few ingredients for dinner that night. You’ll have certain expectations about your shopping experience: to find what you want easily and quickly, and to move seamlessly through check-out. A website is like that store. In order to please “shoppers,” web developers can use these 5 tools for providing positive user experience (UX).
1. Google Analytics, for useful overviews of user behavior
Whether you are a web manager or a grocery store owner, you need to know how people interact with your business.
Imagine you have the ability to follow customers as they shop at your grocery store (without being creepy or intrusive, of course!).
What actions would you want to see? Customers winding their ways through aisles, putting plenty of products into their carts, and checking out quickly. And, especially, customers who become regular shoppers!
What actions would cause you concern? Customers wandering back and forth between aisles, unable to find what they want. Customers fruitlessly looking for assistance. Customers waiting in long lines. And, especially, customers leaving without making a purchase and never coming back.
Web managers have similar goals. They want visitors to easily find what they need, stay on the site, and return later.
Google Analytics tells you how much time people are spending on your site. It tells you which pages they’re visiting most often and how they’re getting there. Google Analytics indicates whether users are merely visiting one page and then “bouncing” off or visiting multiple pages. It can help you analyze funnels to see where you might be losing potential customers.
2. Hotjar, for digging deeper into site interactions
Traditional web analytics tools are a little like a grocery store owner getting information by monitoring the front door. For more in-depth information, you’ll want to use a tool such as Hotjar.
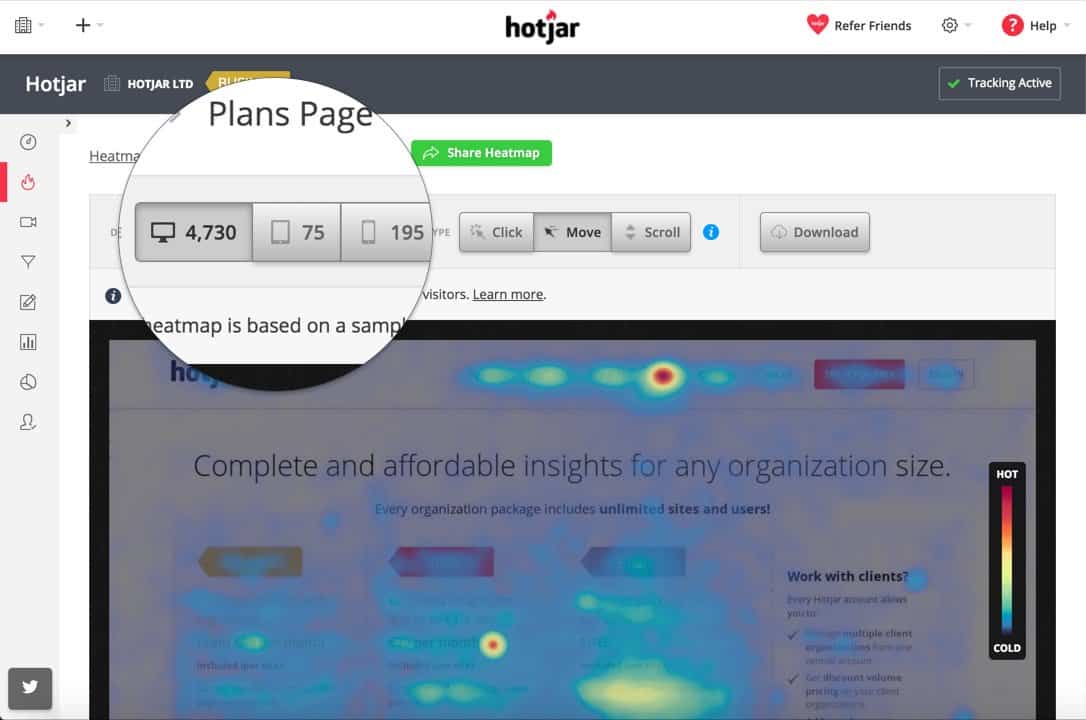
Hotjar heat maps help you visualize visitors’ behavior. By visually representing users’ clicks, taps and scrolling behavior – the strongest indicators of user motivation and desire – you can better understand what visitors want, care about, and do on your site.
Tools on Hotjar include scroll maps (see how far users scroll down your pages), click maps (what links they click on), and move maps (where they move their mouse, thus what captures readers’ attention).
3. User testing, a website’s not-so-secret shopper
The grocery store manager who views customers’ behavior from afar will miss the human factors. The manager might even misinterpret their actions. For example:
- One customer wandered aimlessly from row to row because he didn’t know what he wanted for dinner and was browsing for ideas. Another wandered aimlessly because he couldn’t find what he wanted.
- One woman left the store quickly because she was late for her daughter’s soccer game. Another left quickly because she found the store to be dark and dirty.
User testing connects with real people to engage with a product, service, or website. User testing not only notes behavior, it also asks about the experience.
Test participants should reflect your target audience. Rather than simply navigating the website, they can narrate the experience. They describe what they find difficult, tedious, unattractive, unappealing, etc. They can answer questions you’ve had about the site. Paying attention to their behavior and answers can help you create a positive UX.
4. Google PageSpeed Insight, for providing positive user experience through speed
Just as shoppers get impatient waiting in lines at a store, so web users get impatient with slow-loading web pages. A shopper usually waits anyway, knowing that giving up and going to a different store will waste even more time. A web user, however, gives up easily. After all, switching to a faster page saves time!
Having fast-loading pages is important to provide positive user experience and keep visitors on your site long enough to act.
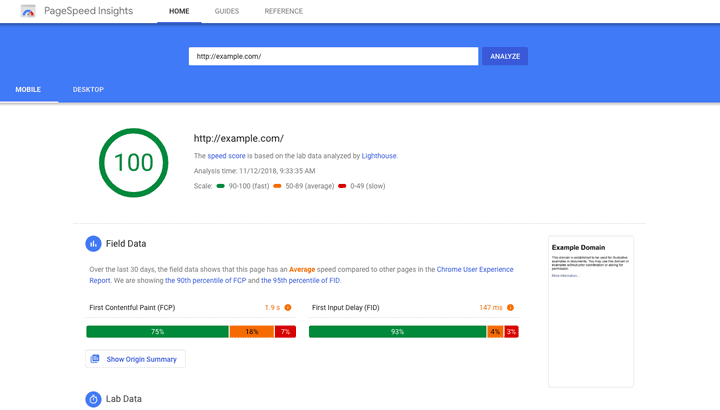
How quickly do your web pages load? To get an objective answer, try Google PageSpeed Insights. This online tool also gives a PageSpeed score suggestions for speeding up your web site.
5. Image alt tags, for aiding accessibility
Grocery stores have proven strategies to make shopping accessible to more customers. They provide handicapped parking spaces, ramps, and electric shopping carts. They ensure that produce bags and produce are low enough to be reached from wheelchair level.
Web developers can take easy steps to make web sites more accessible, too. Alt tags is one of those steps.
Image alt tags are added in the backend when inserting an image into a post. Typically, we think of them as SEO tools. Thus, we add a description of the image and include keywords, to build a page’s likelihood of getting included on search engine results pages (SERPs).
But they can serve another, very important purpose. Alt tags are used by screen readers – the browsers used by blind and visually impaired people. The screen readers read the alt tag to tell users about an image.
The happier your website visitors are, the more likely they are to heed your call to action. Whether that action is making a purchase, filling out a contact form, calling to set an appointment, or engaging with your advertisers, a positive UX can help you achieve that goal. Set your goal as providing a positive user experience.
If you need help building and promoting an effective website, connect with a full-service digital media agency, like Ross Media Solutions, as your one-stop shop to take your site and your business to the next level.